
The figures for these financial statements are prepared in accordance with the accounting principles based on Japanese law. Accordingly, they do not necessarily match the figures in the Annual Report issued by the Company, which present the same statements in a form that is more familiar to foreign readers through certain reclassifications or the summarization of accounts.
Changes in Consolidated Financial Results
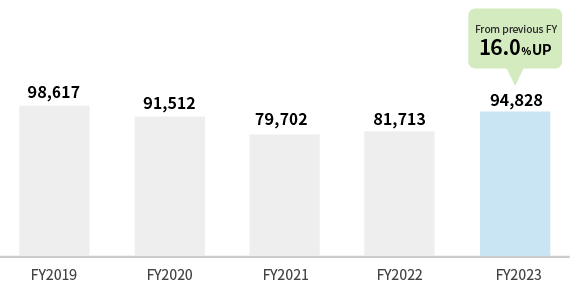
Net sales
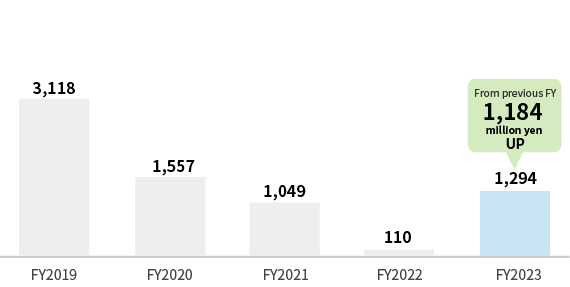
Operating income
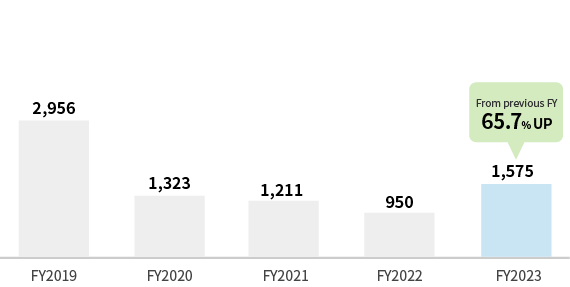
Ordinary income
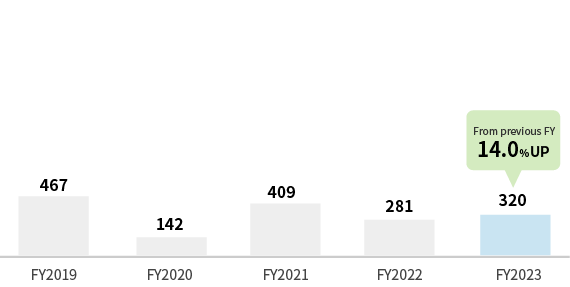
Profit attributable to owners of parent
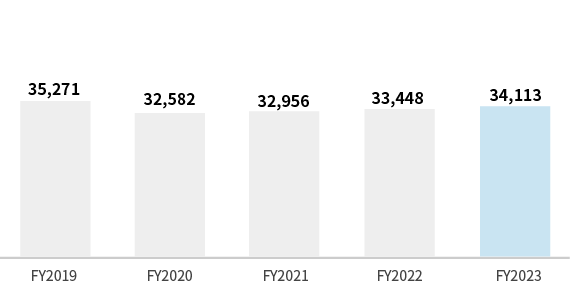
Net assets
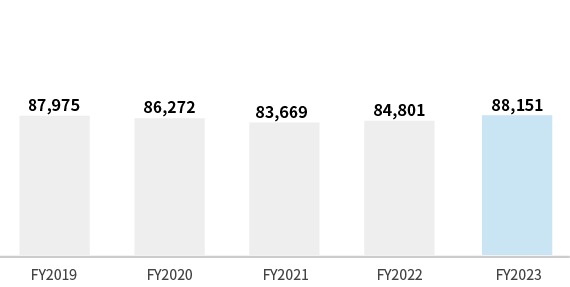
Total assets
| (Millions of Yen) | ||||||
| FY2021 | FY2022 | FY2023 | FY2024 | FY2025 | From previous FY | |
|---|---|---|---|---|---|---|
| Net sales | 79,702 | 81,713 | 94,828 | 103,478 | 104,791 | 1.3% UP |
| Operating income | 1,049 | 110 | 1,294 | 3,300 | 3,001 | 9.0% DOWN |
| Ordinary income | 1,211 | 950 | 1,575 | 3,668 | 2,514 | 31.5% DOWN |
| Profit attributable to owners of parent | 409 | 281 | 320 | 874 | 669 | 23.4% DOWN |
| Net assets | 32,956 | 33,448 | 34,113 | 37,687 | 37,163 | - |
| Total assets | 83,669 | 84,801 | 88,151 | 92,199 | 94,976 | - |
Net Sales by Segment

- (Millions of Yen)
-
- FY2021
- FY2022
- FY2023
- FY2024
- FY2025
-
- Interior Fittings
- 31,024
- 32,811
- 36,598
- 37,142
- 38,264
-
- Automotive Textiles and Traffic Facilities
- 45,102
- 45,005
- 54,314
- 62,800
- 63,478
-
- Functional Materials
- 3,130
- 3,548
- 3,550
- 3,127
- 2,566
-
- Other
- 445
- 349
- 365
- 407
- 481
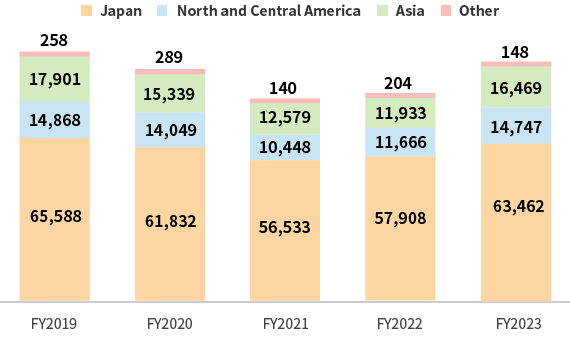
Net Sales by Region
- (Millions of Yen)
-
- FY2021
- FY2022
- FY2023
- FY2024
- FY2025
-
- Japan
- 56,533
- 57,908
- 63,462
- 68,577
- 69,003
-
- North and Central America
- 10,448
- 11,666
- 14,747
- 21,047
- 19,017
-
- Asia
- 12,579
- 11,933
- 16,469
- 13,797
- 16,240
-
- Other
- 140
- 204
- 148
- 55
- 530
Major Management Indexes
| FY2021 | FY2022 | FY2023 | FY2024 | FY2025 | |
|---|---|---|---|---|---|
| Equity ratio (%) | 33.5% | 33.4% | 32.7% | 34.7% | 32.8% |
| ROE(%) | 1.5% | 1.0% | 1.1% | 2.9% | 2.1% |
| Price / earnings ratio (Times) | 29.3 | 37.8 | 43.4 | 18.8 | 23.1 |
| Payout ratio (%) | 54.0% | 157.5% | 108.8% | 52.9% | 79.7% |
| Book-value per share (Yen)* | 2,219.34 | 2,235.25 | 2,274.88 | 2,371.35 | 2,354.28 |
| Profit per share (Yen)* | 32.42 | 22.22 | 25.27 | 66.11 | 50.18 |
| Number of employees of consolidated group companies | 2,724 | 2,640 | 2,779 | 2,812 | 2,943 |
| Dividend per share (Yen)* | 17.5 | 35 | 27.5 | 35 | 40 |
| Fiscal year-end share price (Yen)* | 950 | 840 | 1,097.5 | 1,246 | 1,160 |
| Capital investment (Millions of Yen) | 2,677 | 4,636 | 2,441 | 3,875 | 3,221 |
| Depreciation (Millions of Yen) | 1,979 | 1,915 | 2,229 | 2,257 | 2,289 |
The Company conducted a 2-for-1 stock split of its common stock with an effective date of March 1, 2025. The figures shown above are calcurated assuming that the stock split was conducted.